
From AWS S3 to Amazon Redshift with AWS Lambda
AWS

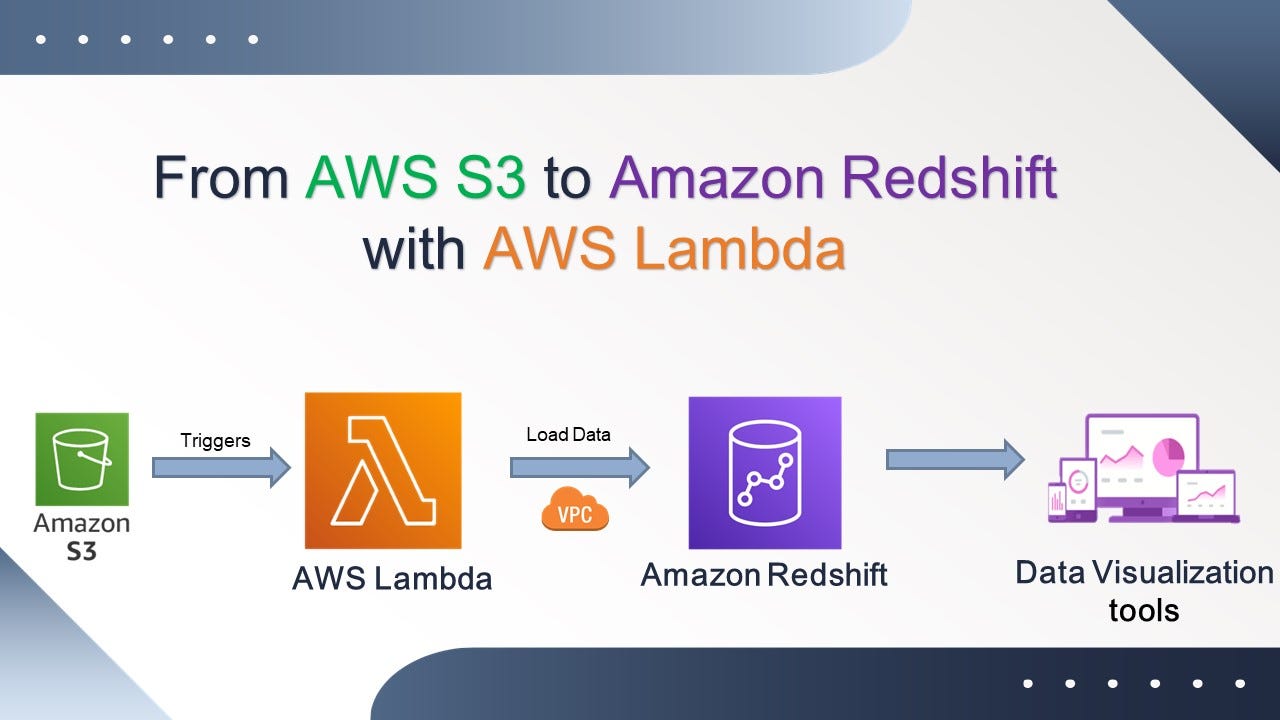
This project aims to dynamically upload files to an Amazon Redshift database using an Amazon S3 bucket and an AWS Lambda function triggered by events.
S3 Configuration
Create a bucket in the desired region, configure access options and optionally, add a policy to the bucket to control access.
IAM Configuration
Create an IAM User:
Assign the following permissions:
AmazonRedshiftFullAccessAmazonS3ReadOnlyAccessAWSLambda_FullAccess
Generate an Access Key for the user.
Create an IAM Role:
Assign the following permissions to the role:
AmazonEC2FullAccessAmazonRedshiftFullAccessAmazonS3ReadOnlyAccessAWSLambdaBasicExecutionRole
AWS Lambda Configuration
Create a Lambda Function:
Choose Python as the language.
Assign the previously created execution role.
Add a Trigger:
In the Lambda function configuration, add a trigger for the S3 bucket or in the S3 bucket properties create event configuration and choose Lambda function as destination.
Configure the event type (e.g.,
s3:ObjectCreated:*).Specify the prefix or suffix if necessary.
Configure VPC:
Associate the Lambda function with the same VPC used by the Redshift cluster.
Create a Layer for psycopg2:
Download the
psycopg2module from this repository (https://github.com/jkehler/awslambda-psycopg2) for the Python version you are using.Add this module as a layer to the Lambda function.
Amazon Redshift Configuration
Create a Redshift Cluster and associate an IAM role with permissions to use Redshift and access the S3 bucket and create a schema within the Redshift database where the data will be stored.
Execution
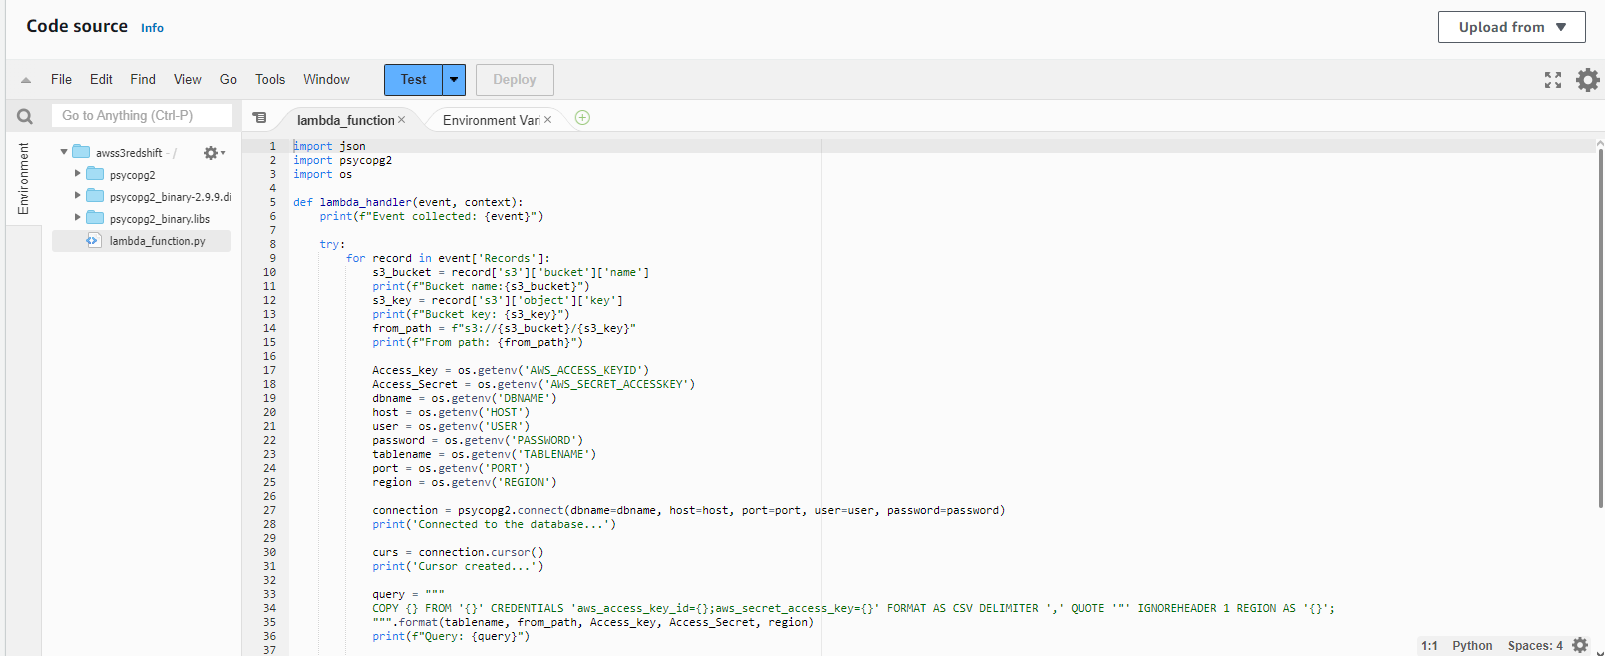
Write the Lambda Code:
The code should connect to Redshift and copy the files from the S3 bucket to the database.
Configure Environment Variables:
In the Lambda configuration, add the necessary environment variables (e.g.,
AWS_ACCESS_KEYandAWS_SECRET_ACCESS_KEYobtained from the previously created IAM user).
https://github.com/Cuchuflim/s3-redshift-lambda
Monitoring Data Load with CloudWatch Logs
For Visualization and Notifications use CloudWatch dashboards to visualize metrics and logs in real-time.
Data Visualization Connection
Once the data is in Redshift, you can connect it to a data visualization tool like Tableau, Power BI, or Amazon QuickSight for analysis and reporting.
Notes:
Security: Ensure that keys and sensitive information are handled securely.
Testing: Conduct thorough testing to ensure the data flow works correctly.